Halloween lovers, I humbly present to you what might be my crowning pumpkin carving achievement – the Graph-O’-Lantern – 6% pie, 5% Venn, 13% bar, and 100% gourd!

My Graph-O'-Lantern
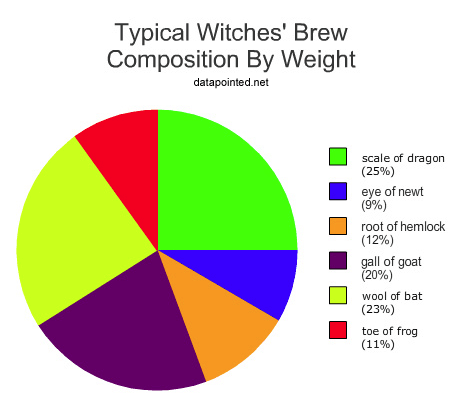
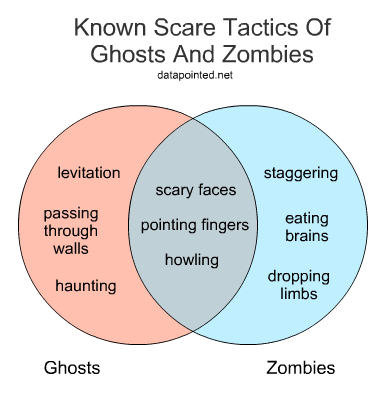
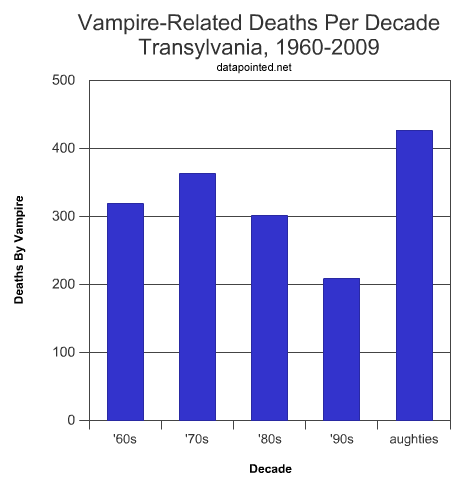
The titles and labels didn’t fit, so here’s the complete version of each chart, clockwise from the upper-left:
- Typical Witches’ Brew Composition By Weight (pie chart)
- Known Scare Tactics Of Ghosts And Zombies (Venn diagram)
- Vampire-Related Deaths Per Decade, Transylvania, 1960-2009 (bar graph)
Only four more days ’til Halloween night!